Buffer Overflows & NOOP Sleds
What is a Buffer Overflow?
A buffer overflow is a type of memory corruption vulnerability. We will review how program memory is used, how a buffer overflow occurs, and how the overflow can be used to control the execution flow of an application.
A buffer overflow aims to execute a specific shellcode from an unknown memory address. The sled is prepended to the shellcode to enable a relative return pointer that will land on the sled, eventually executing the specific shellcode.
x86 Architecture
To understand how memory corruptions occur and how they can be leveraged into unauthorized access, we need to discuss program memory, understand how software works at the CPU level, and outline a few basic definitions.
Program Memory
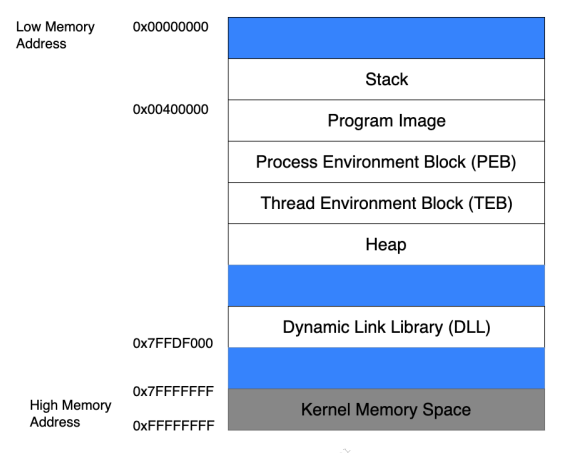
When a binary application is executed, it follows a specific memory allocation pattern within the memory boundaries typical of modern computers. The Picture below shows how process memory is allocated in Windows between the lowest memory address (0x00000000) and the highest memory address(0x7FFFFFFF) used by applications. Although several memory areas are outlined in this figure, we will solely focus on the stack for our purposes.
The Stack
While executing, a thread runs code from the Program Image or different Dynamic Link Libraries (DLLs). Each thread necessitates a short-term data area for functions, local variables, and program control information, commonly called the stack. To enable independent execution of multiple threads, each thread within an active application possesses its stack.
The CPU perceives stack memory as a Last-In First-Out (LIFO) structure. This structure indicates that when accessing the stack, items placed ("pushed") on the top of the stack are the first to be removed ("popped"). The x86 architecture employs specific PUSH and POP assembly instructions to add or remove data from the stack, respectively.
Function Return Mechanics
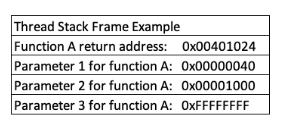
When code in a thread invokes a function, it requires knowledge of the address to return to after the function finishes executing. This "return address," along with the function's parameters and local variables, is stored on the stack. This set of data, related to a single function call, resides in a segment of the stack memory referred to as a stack frame.
Upon the conclusion of a function, the return address is retrieved from the stack and utilized to resume the execution flow to either the main program or the calling function. Though this offers a high-level overview, delving into how this occurs at the CPU level necessitates understanding CPU registers.
CPU Registers
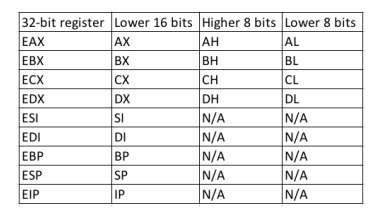
For code execution, the CPU utilizes a set of nine 32-bit registers (on a 32-bit platform). Registers are small, high-speed CPU storage areas where data can be efficiently read or manipulated.
ESP - The Stack Pointer
The stack is used to store data, pointers, and arguments. Since the stack is dynamic and changes constantly during program execution, ESP, the stack pointer, keeps "track" of the most recently referenced location on the stack (top of the stack) by storing a pointer.
!!! Note: A pointer refers to an address (or location) in memory. When we say a register "stores a pointer" or "points" to an address, this essentially means that the register is storing that target address.
EBP - The Base Pointer
During thread execution, as the stack undergoes continuous changes, it can be challenging for a function to find its respective stack frame containing essential arguments, local variables, and the return address. EBP, or the base pointer, resolves this issue by storing a pointer at the top of the stack when a function is invoked. By accessing EBP, a function can efficiently access information from its stack frame through offsets while executing.
EIP - The Instruction Pointer
EIP, known as the instruction pointer, is necessary for our objectives as it constantly indicates the next code instruction to be executed. Since EIP governs the program's flow, it becomes the primary target for attackers when exploiting memory corruption vulnerabilities like buffer overflows.
Buffer Overflow Walkthrough
- Attack Vector Sequence
- The vulnerable program runs from the command line.
- During the function call of the program, the exploit is injected, and buffer overflow occurs
- This overwrites the buffer, original program code, Original address pointer value, and potentially other adjacent memory.
- Function call finishes executing, and the new malicious return address is loaded into the stack.
- CPU performs its usual "fetch, decode, execute" cycle using the new return address, which points to your NOP sled
- Slide, Execute, Launch, and Goal achieved.
NOOP Sleds
A NOOP sled is a sequence of NOOP (no-operation) instructions that are inserted into the memory of a vulnerable program. The purpose of the NOOP sled is to create a larger landing area for the instruction pointer to land on, so it eventually reaches and executes the shellcode. In x86 assembly, the NOOP instruction is 0x90
End of lesson
Vulnerable Program Example
Create Shellcode and NOOP Sled
-
Shellcode: This is the code you want to execute when the overflow happens. For this example, let's use a simple shellcode that spawns a shell. (Make sure to use shellcode that is appropriate for your environment and architecture.)
-
NOOP Sled: The NOOP sled is a series of NOOP instructions (0x90 in hexadecimal). For example, you might use 100 NOOP instructions followed by the shellcode.
Here’s a conceptual representation:
Construct Exploit Payload
Combine the NOOP sled and shellcode into a single exploit payload:
Execute the Exploit
- Compile the vulnerable code.(use a compiler like gcc)
- Run the compiled program with the exploit payload. For example:


